
Your data is accumulating at an astonishing rate. You need to summarize the data from one or several sources to become actionable.
Your data is spread out in different location and bringing it together to make a decision is a project in itself. We leverage PowerBI and ETL tools to aggregate your data into one location and then generate dashboards so business level decisions can be made.
We published a solution available in the Microsoft partner showcase. The solution focuses on understanding the health of the code in QUBO algorithm We run a sanity test on each check-in and then a more comprehensive test suite each night there was a check-in. The reporting provided Azure DevOps Analytics for build / tests provided was not enough to evaluate the algorithm performance, so we augmented the information from the tests and created this report. information from a test runner point of view.
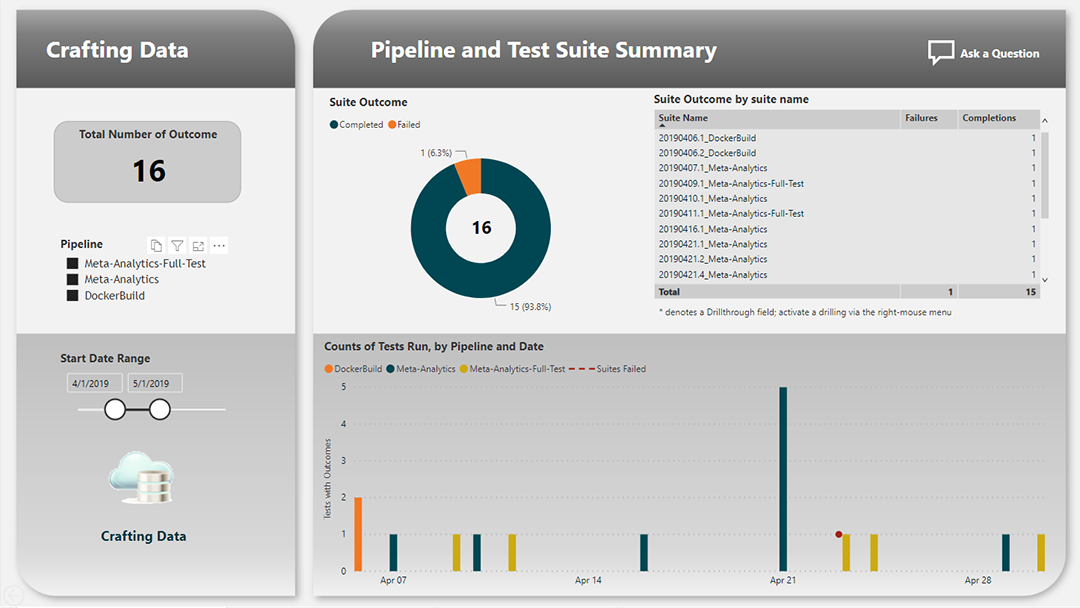
- What is the health of the tests for each pipeline ?
- For each test, how long did the algorithm take to run ?
- What is the trend for each test run ?
- Did the algorithm find the correct answer for this test ?
- If a test failed, was it because of a incorrect result or from maximum time allowed for the test ?
- What is the history for a specific test (using Q&A) ?
- When did the last test suite fail (using Q&A) ?